Calls to action click-through
Check how often people see and click your calls to action.
Before you start
- Sign in to the admin portal with your customer account. See Sign up and sign in.
- Set up at least one call to action. See Calls to action.
- Know that the section sits on the Usage page and follows its date range. See Usage view.
Steps
-
In Cobrand settings, select Usage.
-
Under Date range, choose the period you want.
-
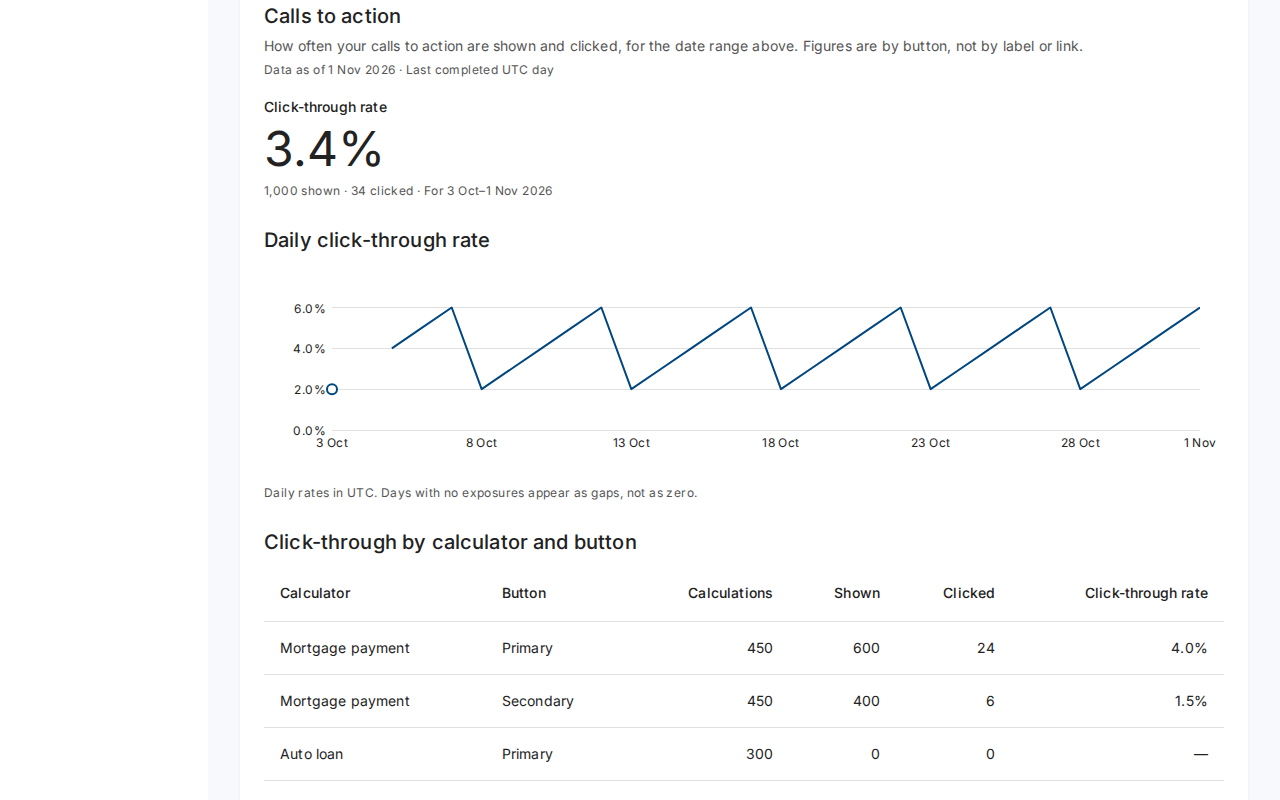
Scroll to Calls to action. The Click-through rate shows the share of shown calls to action that people clicked, with the shown and clicked counts.
-
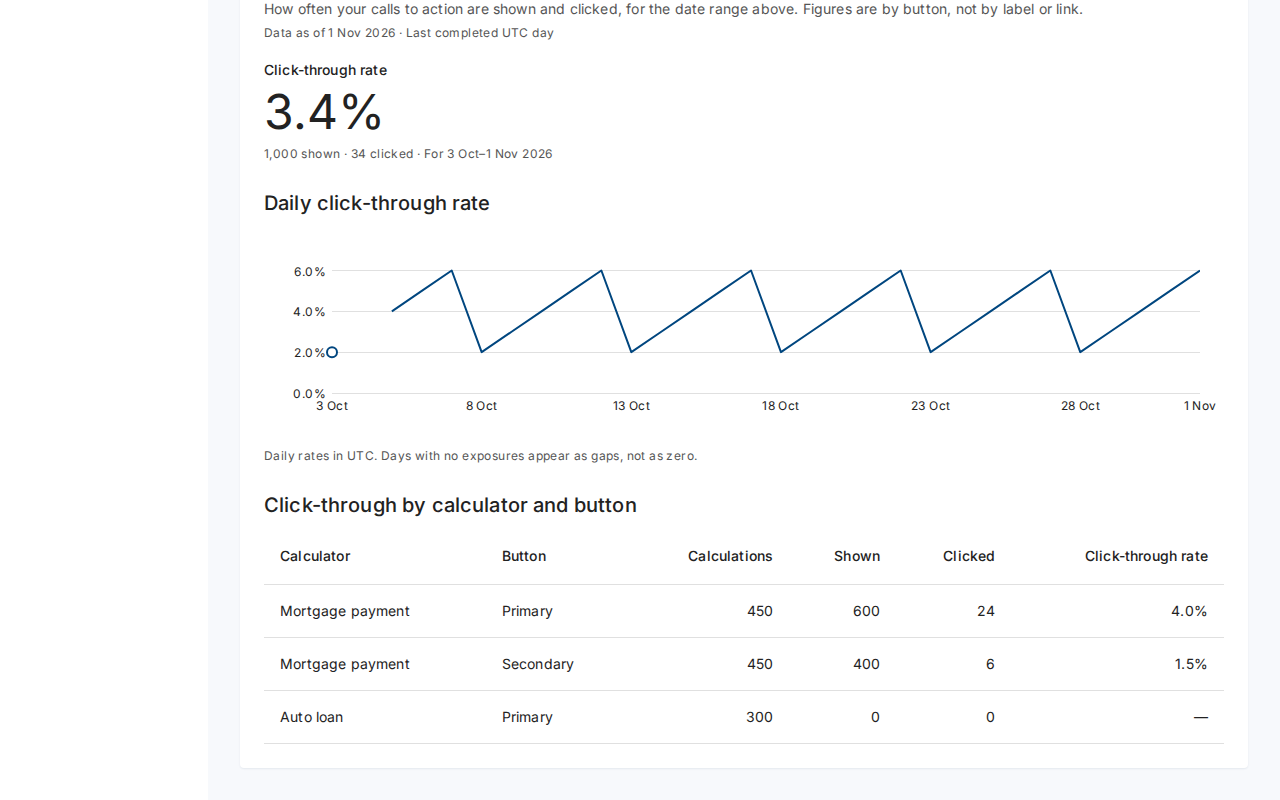
Read Click-through by calculator and button. Each row gives the Shown, Clicked and Click-through rate for a calculator's Primary or Secondary button.
What you see when it works
- A headline rate, such as 3.4%, with the totals for the range.
- A Daily click-through rate chart in UTC. Days with no views show as gaps, not zero.
- A row shows No exposures when nobody saw that button in the range.
- Figures count buttons only, never labels, links or personal data.
Troubleshooting
-
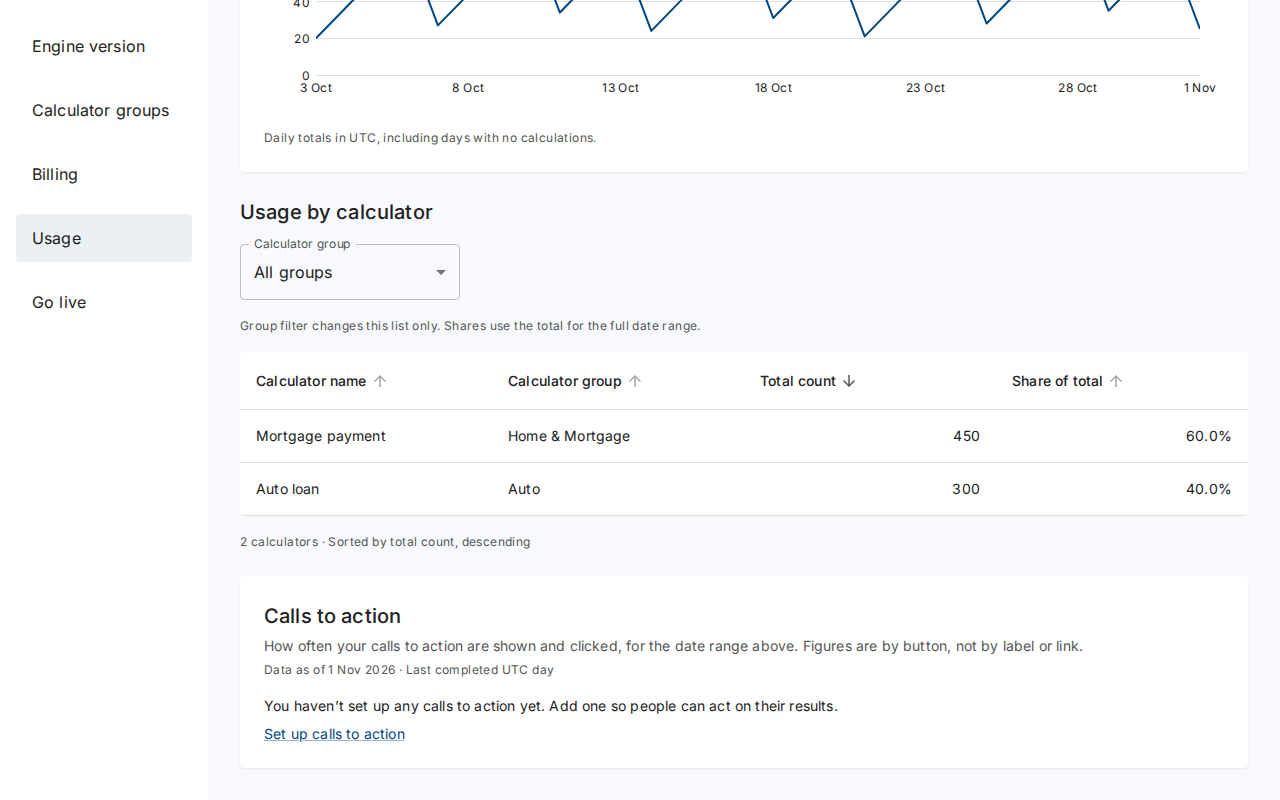
You haven’t set up any calls to action yet. Select Set up calls to action to add one.
-
The portal shows no calls to action for this period. Try a longer date range. Choose 90 days or a wider custom range.
-
Calls to action data is temporarily unavailable. Select Reload. Your usage figures stay on the page.